The Lasting Effects of Redlining 70 Years Later and Its Direct Relationship to COVID
- oliviagingold
- Sep 8, 2020
- 7 min read
Updated: Sep 8, 2020
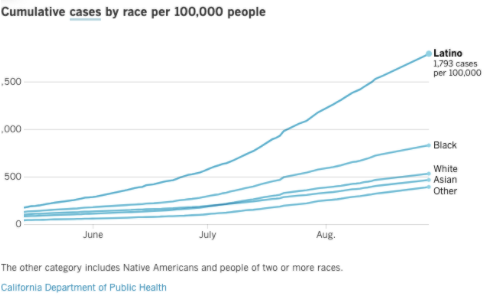
Since January 2020, COVID-19 has infected 5.95 million individuals in the United States. 699 thousand of these cases have been in California alone. Although coronavirus has hit the entire country - and the entire world medically, emotionally, and economically, it has also undoubtedly impacted BIPOC and lower-income communities at higher rates. When one looks at cases reported for COVID by racial breakdowns, it becomes clear that Latinx and Black communities have been hit the hardest by this pandemic. The Latinx community was 3.4 times more likely to contract coronavirus, while Black people were almost twice as likely to contract coronavirus as whites, Asians, or other races. (1 | 2) Many factors have contributed to this increased risk for poor and/or Black communities.

The Legacy of Redlining and the Conditions It's Created
Redlining, which has been rightfully referred to as a “state-sponsored system of segregation” by historian Richard Rothstein, was a historical practice that began in the United States in the post-depression period.(3) Although illegal today, this practice also created path dependencies and structural segregations which persist today, the effects of which exacerbate and may help explain the increase rate of coronavirus transmission for BIPOC.
Danyelle Solomon of the Center for American Progress gave a thorough overview of the practice of redlining in her article “Systemic Inequality: Displacement, Exclusion, and Segregation.” In 1933 and 1934 during the New Deal era, in the midst of attempts to bolster the economy through public-spending programs that would provide welfare to struggling families and also create jobs for those out of work, 2 federal offices known as the “Homeowners Loan Corporation” or “HOLC” and the “Federal Housing Administration” or “FHA” were created in order to reduce the rate of foreclosure and make home ownership more accessible. The issue with these organizations is that they were inherently racist. HOLC - the organization that actually provided loans to Americans seeking housing - used racial composition of the neighborhood as a factor when assessing the neighborhood’s risk.
The Home Owners Loan Corporation then drew maps of neighborhoods, designating the safest neighborhoods a rating of green for “best,” blue for “still desirable,” yellow for “definitely declining” and red for “hazardous.” (4) Redlining not only denied Black people and other People of Color access to certain neighborhoods by denying them loans to properties (some neighborhoods went as far as to specifically advertise themselves as “white only”). Redlining also denied Black people and other People of Color access to mortgage refinancing, and contributed to the general misconception that BIPOC would be harmful applicants, either because of their financial risk, or because they’d make neighborhoods less safe. (5) Although Redlining was made illegal in 1968 with the passing of the Fair Housing Act, its effects still persist because of the path dependencies present.
Not only is homeownership the number one method of accumulating wealth, but Redlined neighborhoods also historically received and continue to receive less funding, leading to lower home values, and higher rates of poverty in their neighborhoods. To this day, somewhere around 75% of neighborhoods that were deemed “red” in the 1930s remain low to moderate income, north of 60% of them remain predominantly nonwhite. (6) Worse, areas which managed to become middle- to upper-income were often gentrified, meaning that BIPOC were forced out, rather than reaping the supposed benefits of “improvements” in neighborhoods they had previously called home. (7)
It is shown that red-lined areas are lower-income, have lower median household values, and older housing stocks. This creates a feedback loop which continues in a vicious cycle where low-income individuals buy homes in formerly redlined areas, and then are excluded from reaping benefits from newer housing stocks, higher home values, and taxes, or are forced out by gentrification. (8)
Making matters worse is the racism that persists in lending practices and homeownership regardless of the Fair Housing Act. For a period of time in the 1970’s and 80’s, a “colored tax” on FHA-backed home loans was levied. (9) Loan applicants of color testified that regardless of their income status, it felt like loan officers were “fishing for a reason to say no.” Data concurs that in cities across America, loan applicants of color are turned away from loans at rates significantly higher than those for White people. (10)
Racism is also inherent in policy. Prop 13, which was passed in 1978 in California, wasn’t passed with the overt intention of disenfranchising lower income households. This proposition put a cap on property taxes, thereby ensuring that wealthy people were able to hold on to their expensive properties without facing higher taxes. As the Ella Baker Center for Human Rights explained it: “More land held off the market by the wealthy means less land (especially the most desirable parcels) trading hands between everyone else. (10) The tax cap also hurt lower-income communities by strictly limiting the public sector’s capacity to dedicate funding towards lower income neighborhoods, thereby denying these neighborhoods of opportunity. (11) Phenomenons like this one demonstrate how these feedback loops reinforce one another in both direct and indirect ways in a downward spiral.
Whether redlining persists because of structural factors set in place in the 1930s, or whether it persists because it’s still practiced today in subtler ways, it is undoubtable that redlining exacerbates coronavirus risk. Redlining creates positionality rooted in inequity because individuals who end up in those neighborhoods that impact other factors such as whether or not an individual goes to college, whether or not an individual is forced to take a lower paying job doing essential work, whether or not they have family wealth, whether or not their incomes force them to homeshare or rideshare or use public transportation, these are all factors which individually contribute to coronavirus risk. By reinforcing the cycle of poverty, Redlining exacerbates risk for BIPOC.
Inequities of COVID Based on Economic Status, Employment, and Race
It is undeniable that people living below the poverty line are more likely to contract coronavirus - data that utilizes one’s Medicare status as an indicator of income status revealed that out of all individuals on Medicare who contracted the virus, the poorest individuals (ones on dual-Medicare and Medicaid) were 4 times as likely to contract the coronavirus as those who were only on Medicare. (12 |13) But why is this the case?
Many factors that are closely linked to poverty create increased risk for individuals. Poverty is closely linked with race - 8.1% of white people and 10.1% of Asians live below the poverty line, while 17.6% of Latinx and 20.1% of Blacks live below the poverty line. (14) Because of factors like redlining, lower income communities and communities of color tend to live in more dense or multigenerational households and rely on public transportation or ride sharing to travel to and from work - factors which increase the risk of coronavirus transmission.
The effects of redlining and other manifestations of systemic racism, and the poverty it creates which excludes BIPOC from wealth, often leaves families no choice but to live in multigenerational households. 3.4% of Americans overall live in densely occupied living quarters (1 or more occupants per room), but only 1.4% of white people live in these conditions. For BIPOC, the statistics are as follows: 3.6% for Blacks or African Americans, 7.8% for American Indian and Alaska Natives, 7.2% for Asians, and jumps to a whopping 11% for Hispanics or Latinx families and 14% for Pacific Islanders. (15) The historical exclusion of BIPOC from wealth that would allow for less density shows in the rates for housing density for these individuals. What’s more - this data is collected by the American Census Bureau and may fail to capture undocumented immigrants who fear prosecution. This could mean living density - in Latinx households especially - may be even higher. The risks of living in multi-generational households means a higher risk of one individual contracting the virus and spreading it to others in the households, revealing yet another way that race, redlining, and Coronavirus are closely linked.
BIPOC make up the majority of essential workers in food and agriculture (50%), and in industrial, commercial, and residential services, and facilities (53%), and as a result need to to use rideshare or public transportation to get to work (16). Of those who drove alone to work, 64.7% of those people were white, while 11.2% and 16.7% of Blacks and Latinx respectively drove alone. 19% of Blacks, and 19.9% of Latinx carpooled or commuted, while only 10.1% of whites commuted, meaning nearly twice as many people within communities of color were ridesharing or using public transportation compared to white people. The same was true for people below versus above the poverty line. 19.8% of people below the poverty line carpooled or took public transportation to work, while only 13.5% of people above the poverty line relied on carpooling or public transportation to get to work. Carpooling and public transportation - similar to living in multigenerational households s - exacerbate coronavirus risk by increasing contact with other individuals who may or may not be in one’s household. Driving alone to work undoubtedly reduces the risk of transmission during pandemic conditions, and when the option to drive alone to work is unavailable due to the inequities policies of redlining have created that inhibit BIPOC from building the same generational wealth as white people, it increases their risk of becoming infected.
The Effects of Redlining in the East Bay
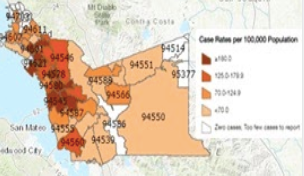
Nowhere is the effect of Redlining on coronavirus transmission more clear than in the East Bay. When maps of the East Bay’s redline zoning are juxtaposed next to the coronavirus case density by zip code, it becomes clear that communities that were historically redlined are now experiencing coronavirus cases at higher rates.


As can be seen in the graphics at right, in neighborhoods, particularly those in West Berkeley, where neighborhoods were coded “red,” the density of coronavirus rates per 100,000 was extremely high. In yellow neighborhoods, the rates were moderate to high, and in green neighborhoods particularly in the north tip of the region, there were low rates of infection or no infection at all. This comparison reveals just how much the neighborhood one lives in influences the potential of becoming infected.
The East Bay was one of the most stringently Redlined portions of the United States, and in recent years - particularly in Oakland - has witnessed booming gentrification at some of the highest rates in the nation, which has only served to exacerbate inequality in the area.
Although the pandemic will subside, the effects of redlining will not. Although Redlining was a historical practice, its lasting effects reveal just how deeply ingrained structures created by path dependencies can become, and how these structures can lead to lower qualities of life and higher risk for those who end up trapped in cycles of poverty or in lower-income areas that will increase their risks - not only for the pandemic, but also at risk for poverty (which is known to be a comorbidity for many other diseases) and at risk for other issues, such as the health issues caused by environmental racism. (17|18)
In order to address this, it is critical that our lawmakers examine the policies that have been created over the years which perpetuate the lower income and racial makeups of neighborhoods and that our voting body elects and holds accountable lawmakers who will do exactly this - to not only generate economic stability, but also enhance public safety for all people.
.png)


Comments